Prometheus 入门实操#
参考文章:Prometheus监控Linux主机 - 吕振江 - 博客园 (cnblogs.com)
1
2
3
4
5
6
7
8
9
| # 下载
wget https://github.com/prometheus/prometheus/releases/download/v2.44.0/prometheus-2.44.0.linux-amd64.tar.gz
# 解压
tar zxf prometheus-2.44.0.linux-amd64.tar.gz
# 移动
mv prometheus-2.24.1.linux-amd64/* /usr/local/prometheus
# 将本机上报
sed -i 's/localhost/你的主机ip/g' /usr/local/prometheus/prometheus.yml
|
启动(systemed,守护进程)#
 1
 2
 3
 4
 5
 6
 7
 8
 9
10
11
12
13
14
15
16
17
18
19
20
21
| cat <<EOF > /usr/lib/systemd/system/prometheus.service
[Unit]
Description=prometheus
After=network.target
[Service]
Type=simple
ExecStart=/usr/local/prometheus/prometheus --config.file=/usr/local/prometheus/prometheus.yml
--storage.tsdb.path=/usr/local/prometheus/data/ --web.enable-lifecycle
--storage.tsdb.retention.time=30d
Restart=on-failure
[Install]
WantedBy=multi-user.target
EOF
systemctl daemon-reload
systemctl start prometheus
systemctl status prometheus && systemctl enable prometheus
|
Ip:9090
管理接口#
 1
 2
 3
 4
 5
 6
 7
 8
 9
10
11
12
| $ curl http://ip:9090/-/healthy
Prometheus is Healthy.
# 健康检查
$ curl http://ip:9090/-/ready
Prometheus is Ready.
# 检查Prometheus是否启动
$ curl -XPOST http://ip:9090/-/reload
# 通过web接口重载,启动时需增加选项 --web.enable-lifecycle
$ curl -XPUT http://ip:9090/-/quit
$ curl -XPOST http://ip:9090/-/quit
# 停止Prometheus
# 同样需启动时增加--web.enable-lifecycle选项
|
grafana安装(centos)#
安装连接参考:Install Grafana on Red Hat, RHEL, or Fedora | Grafana documentation
1
2
3
4
5
| sudo yum install -y https://dl.grafana.com/oss/release/grafana-9.5.2-1.x86_64.rpm
systemctl daemon-reload
systemctl enable grafana-server && systemctl start grafana-server
ss -lnput | grep 3000
tcp LISTEN 0 128 [::]:3000 [::]:* users:(("grafana",pid=1194,fd=10))
|
http://ip:3000/
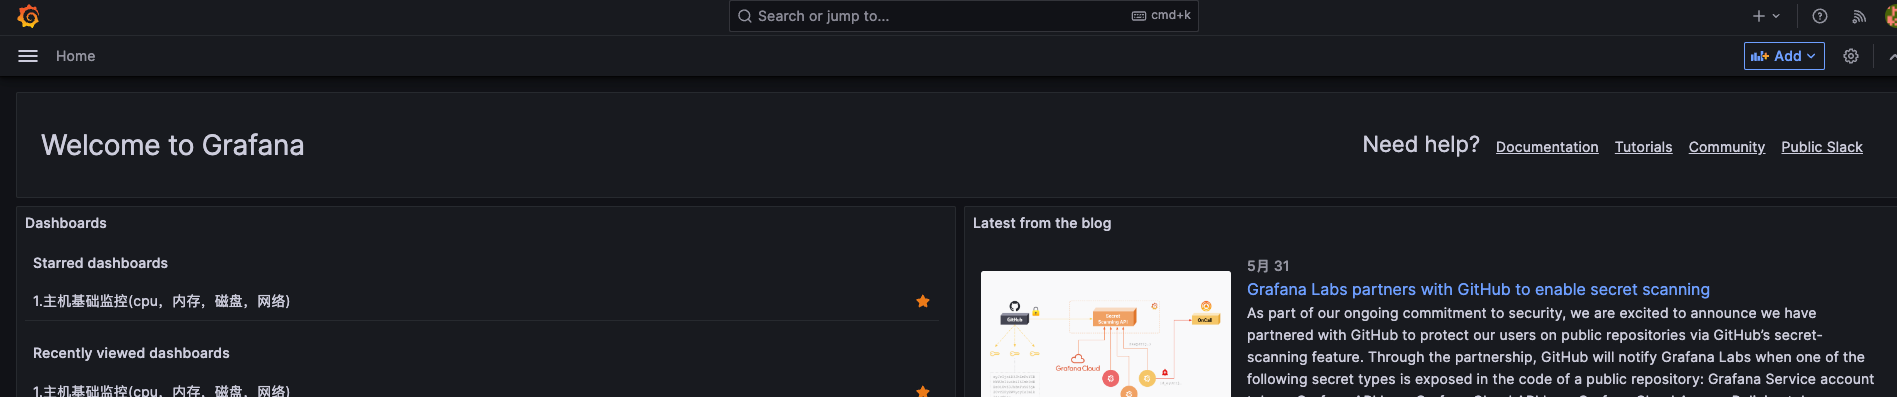
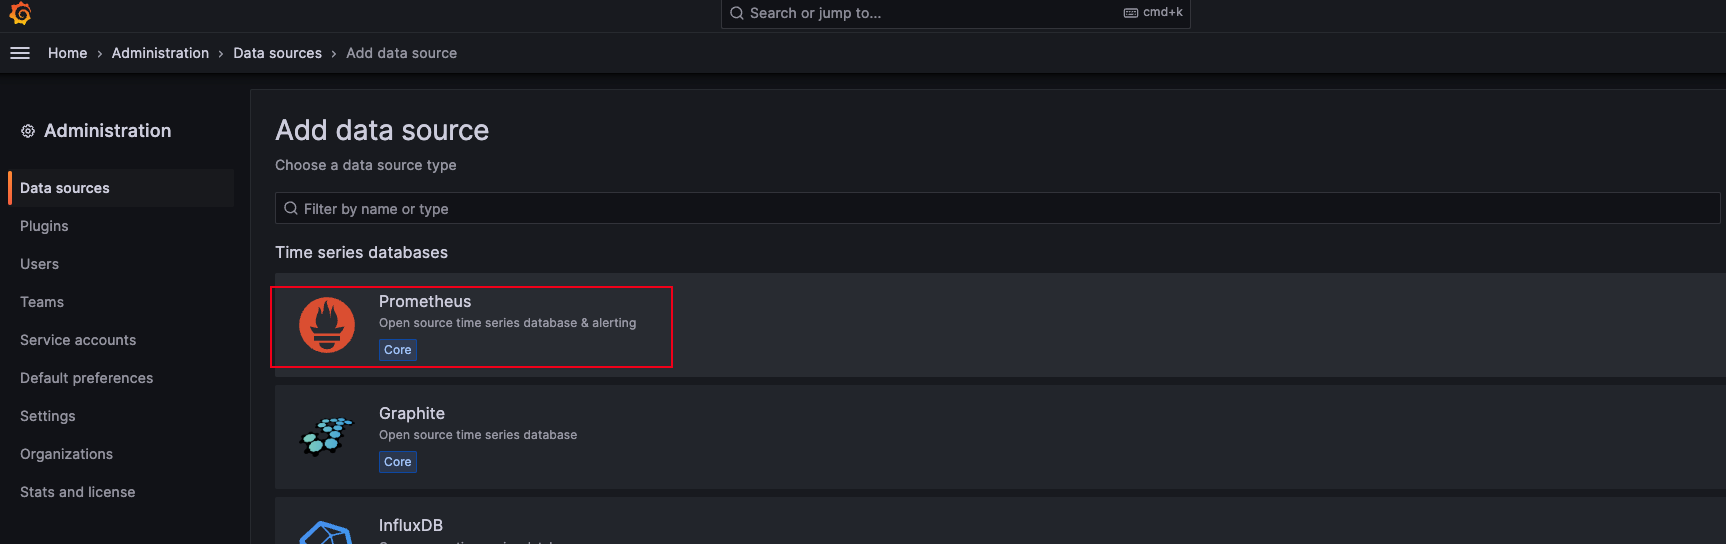
导入 Prometheus 数据#
实战 - 监控主机节点信息#
node_exporter 配置#
node_exporter用于收集主机运行信息,比如CPU、内存、磁盘等资源使用情况。
1
2
3
4
5
6
7
8
| # 下载
wget https://github.com/prometheus/node_exporter/releases/download/v1.6.0/node_exporter-1.6.0.linux-amd64.tar.gz
# 解压
tar zxf node_exporter-1.0.1.linux-amd64.tar.gz
# 移动
mv node_exporter-1.0.1.linux-amd64/* /usr/local/node_exporter/
|
设置 systemd 启动#
 1
 2
 3
 4
 5
 6
 7
 8
 9
10
11
12
13
14
15
| cat > /usr/lib/systemd/system/node_exporter.service <<EOF
[Unit]
Description=node_exporter
After=network.target
[Service]\nType=simple
User=node_exporter
ExecStart=/usr/local/node_exporter/node_exporter
Restart=on-failure
[Install]
WantedBy=multi-user.target
EOF
|
启动服务#
1
2
3
4
5
6
7
| systemctl daemon-reload
systemctl enable node_exporter && systemctl start node_exporter
ss -lnput | grep 9100
tcp LISTEN 0 128 [::]:9100 [::]:* users:(("node_exporter",pid=1155,fd=3))
|
配置 prometheus 监控#
 1
 2
 3
 4
 5
 6
 7
 8
 9
10
11
12
13
14
| $ $ vim /usr/local/prometheus/prometheus.yml
- job_name: 'prometheus'
# metrics_path defaults to '/metrics'
# scheme defaults to 'http'.
static_configs:
- targets: ['ip:9090']
# 增加以下配置,其中job_name为自定义
- job_name: 'agent1'
static_configs:
- targets: ['ip:9100']
# 重载Prometheus配置文件
$ curl -XPOST http://ip:9090/-/reload
|
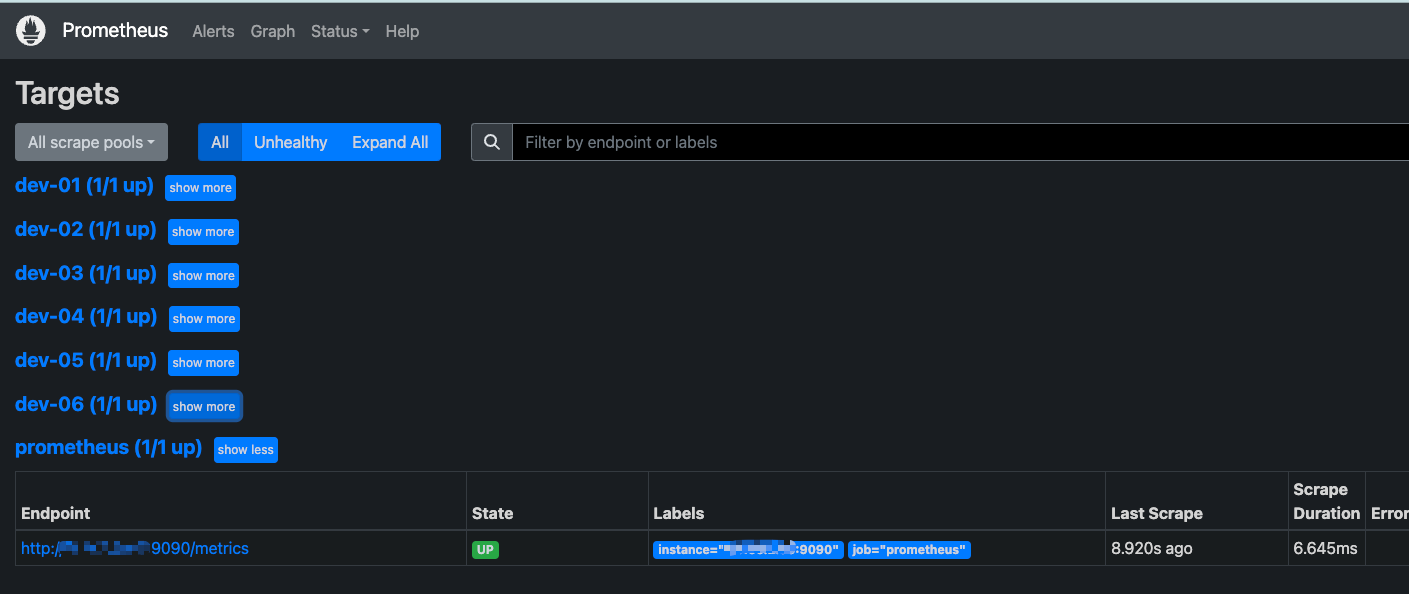
查看node上报状态#

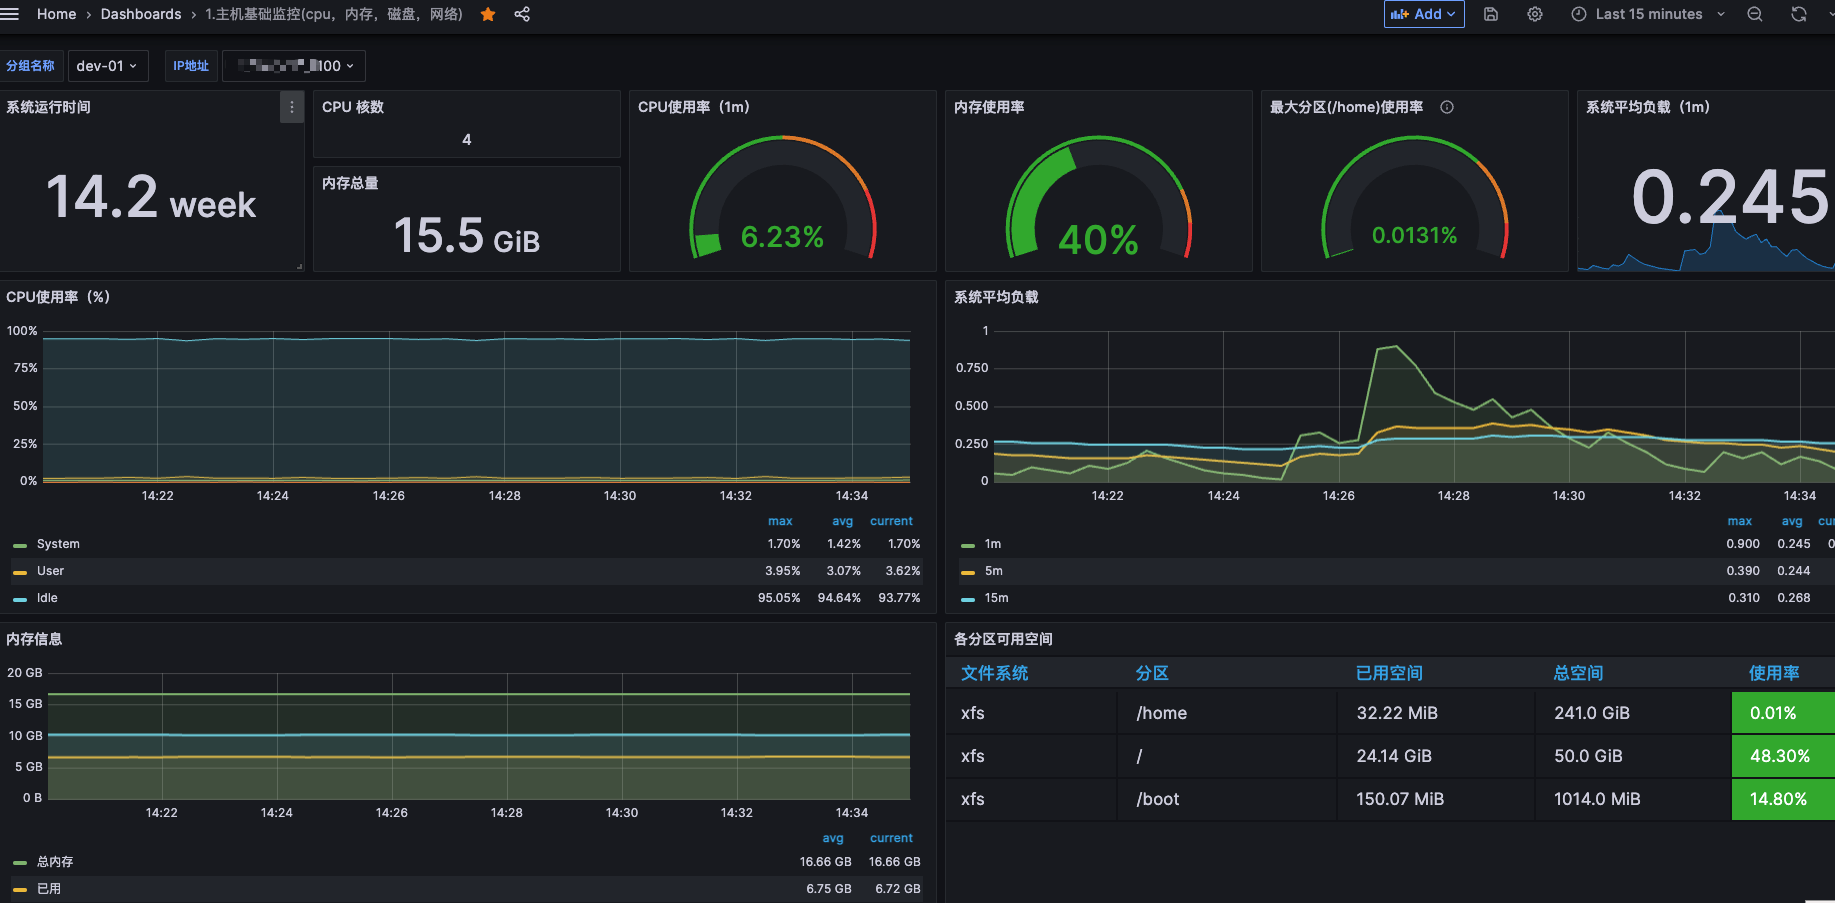
配置 grafana 展示#
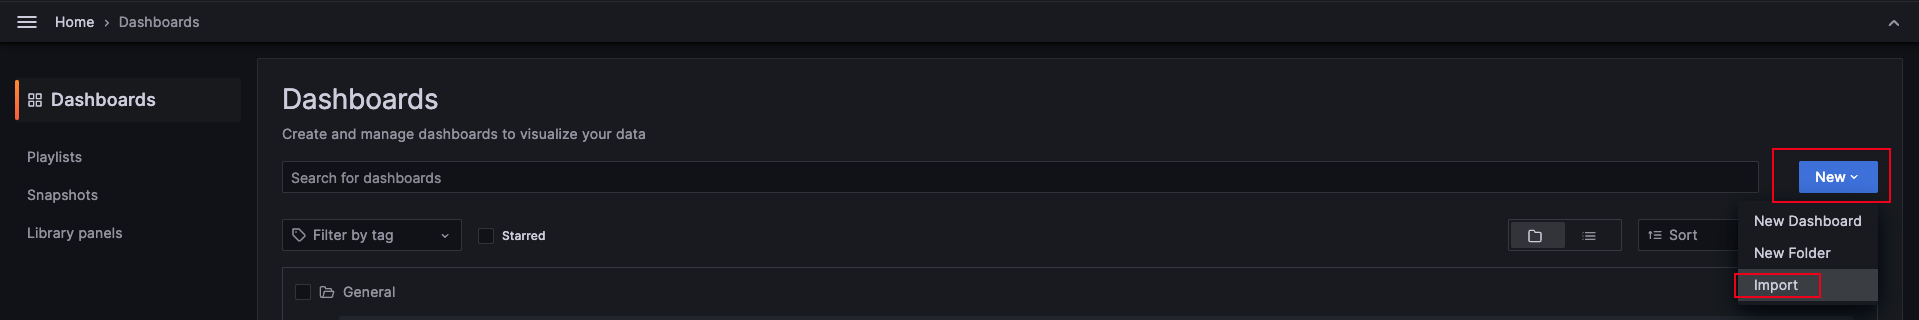
选择 9276 模版号
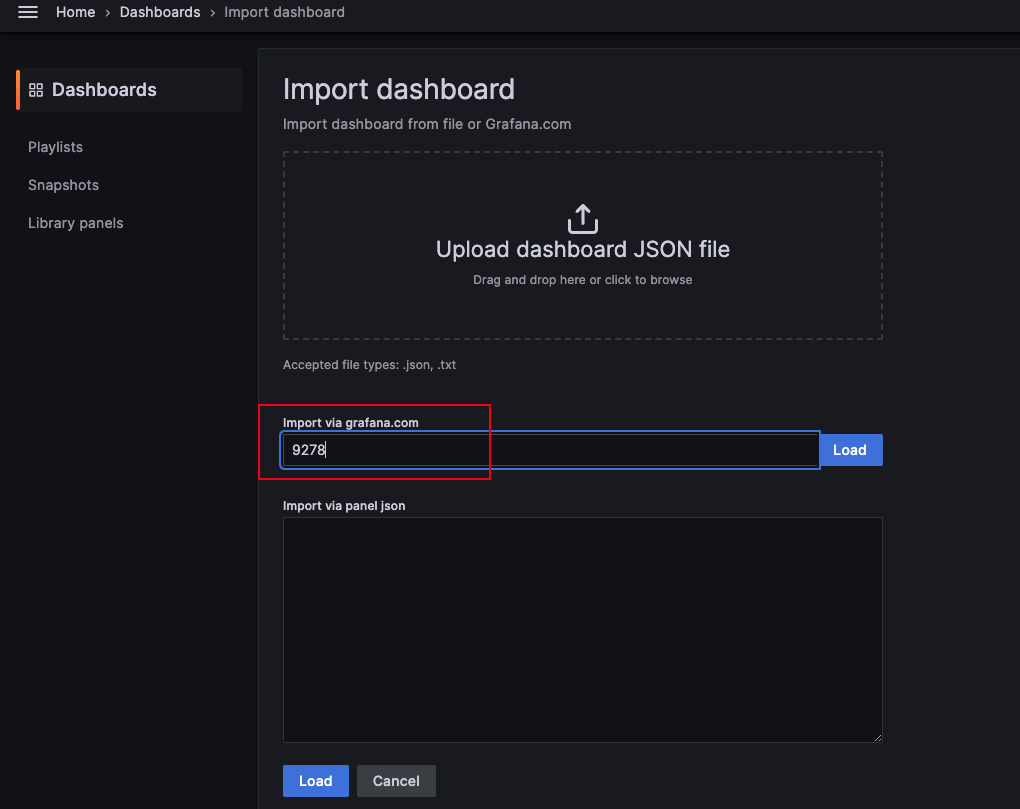
load 之后选择数据源 prometheus
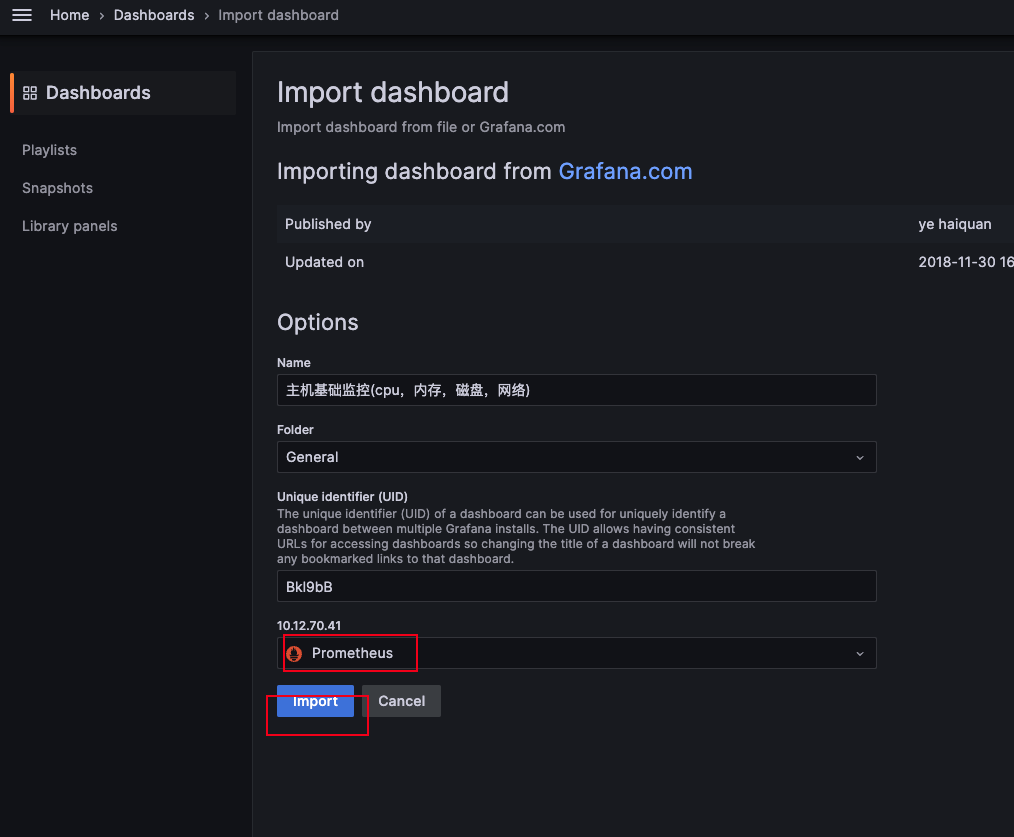
查看效果